Stay informed with the LNN Daily Newsletter
Lethbridge City Hall. (Lethbridge News Now)
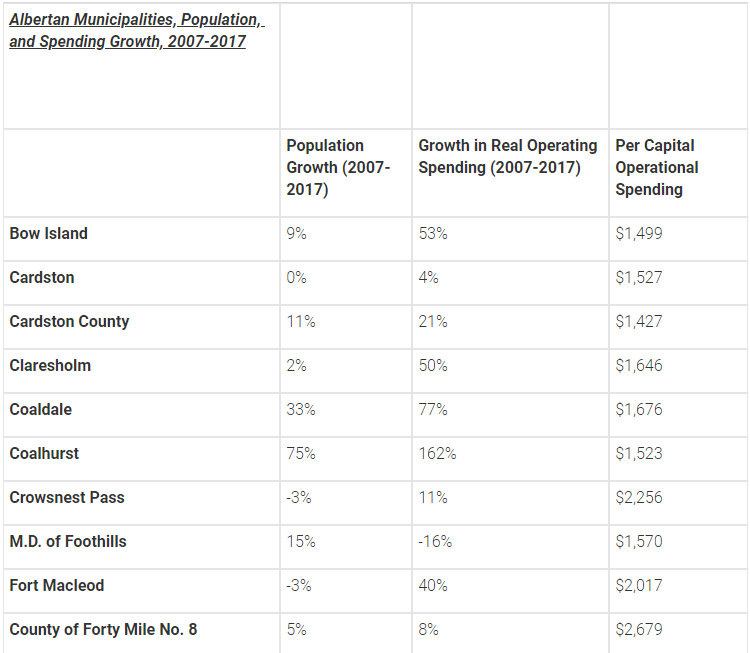
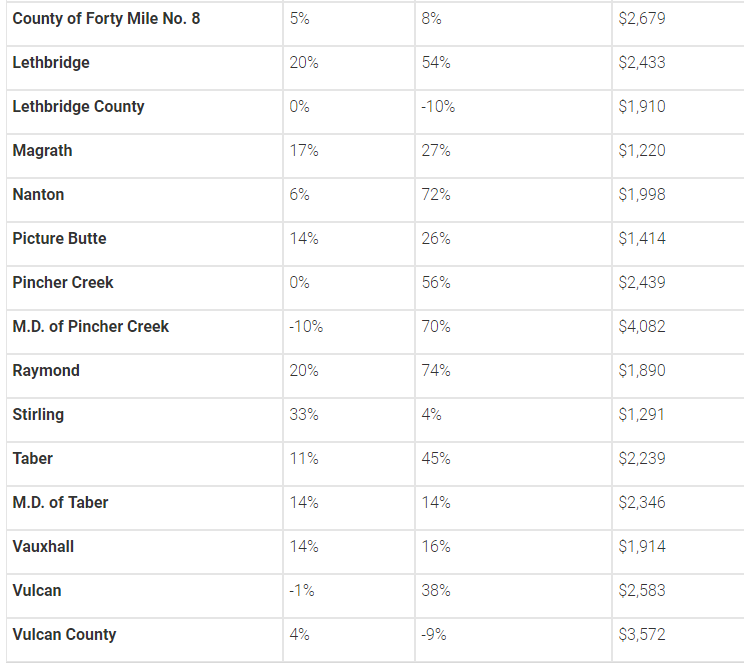
Spending growth numbers across southern AB

Operating spending in Lethbridge grew by 2.5 times the rate of population growth in 2007-2017

Oct 31, 2019 | 3:31 PM

LETHBRIDGE, AB – A new report from the Canadian Federation of Independent Businesses (CFIB) shows real operating spending growth over the last decade in Lethbridge being “quite unsustainable”.

Yet, according to Policy Analyst for Alberta Keyli Kosiorek, it’s in the middle of the pack for the province’s 17 largest cities.

Ranked number nine, real operating spending growth rose by 53.6% from 2007-2017, while the population grew by 20.2%. This means the City of Lethbridge spent $2,443 per capita on “day-to-day spending”.

These numbers are adjusted for inflation.

During this period, Cochrane was the only municipality to lower its spending per capita.

The M.D. of Wood Buffalo, which includes Fort McMurray, was the worst. Operating spending grew by 222% while the population rose by 30.1%.

While Lethbridge is certainly fairing better than Wood Buffalo in this regard, it is worse than the CFIB would like.

“What our business owners that we represent would like to see is keeping spending growth in line with population growth plus inflation,” says Kosiorek. “Lethbridge is about double that with where they are, so quite unsustainable.”

The CFIB also found that Lethbridge had approximately one municipal worker for every 80 residents. This is the same as the similarly-sized Red Deer.

Cochrane had one city employee for every 162 residents, while the M.D. of Wood Buffalo employed one person for every 60 residents.

“This shows that, while municipal governments might not be able to control every aspect of the employee compensation system, they are able to mitigate spending problems by limiting the number of municipal workers that they employ,” says Kosiorek.

The CFIB provided numbers on real operating spending growth, population growth, and operating spending per capita from 2007-2017 for every Albertan municipality.

Below, you can see the numbers for communities in southern Alberta.

Part one of the municipalities, population, and spending growth chart for southern Alberta. (With files from CFIB)
Part two of the municipalities, population, and spending growth chart for southern Alberta. (With files from CFIB)